
Ecosystems & Wildlife 🎯 Grades 6-12 ⏱️ 1 hour 15 minutes 👥 1-30 students

Participatory Community Science Protocols

Environmental Monitoring & Citizen Science • Tyonek Tribal Conservation District Curriculum

Interactive Digital Curriculum

Interactive Walkthrough Slides

Step through the complete digitized curriculum deck with illustrated concepts, step-by-step procedures, teacher tips, and interactive knowledge checks.

🖥️ Interactive Walkthrough Slides
Slide 1 of 6
Download PDF
Slide 1 Citizen Science

What is Participatory Community Science?

Empowering Citizens and Tribal Youth as Field Scientists

Participatory science (community science) occurs when members of the public actively collaborate with professional researchers to collect, analyze, and interpret scientific data.

In Western Cook Inlet, where scientific agencies have limited budgets and personnel, tribal youth and local observers provide the eyes and ears that monitor millions of acres of wild lands.

  • 👀
    Hyper-Local Data: Daily field observations catch environmental changes faster than distant state agencies.
  • 🏛️
    Indigenous Leadership: Tribal communities drive research priorities to protect cultural subsistence foods.
← / → Navigate slides F Fullscreen Esc Exit fullscreen
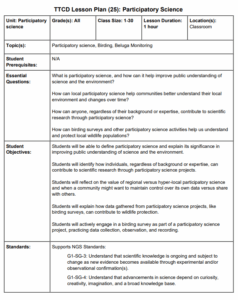
Official curriculum guide preview for Participatory Community Science Protocols
📄 Participatory-Science.pdf

Essential Inquiries & Learning Targets

Core Essential Questions:

  • How does participatory (citizen) science empower tribal community members and youth to collect legally and scientifically defensible environmental data?
  • What standardized protocols govern monitoring ice phenology, seasonal stream temperatures, and migratory bird arrival dates?
  • How do multi-decadal community observations reveal long-term climate changes in Cook Inlet?

Student Learning Objectives:

  • Collect baseline phenology and water quality data using standardized calibration protocols.
  • Log GPS geographic coordinates and upload verified observations to scientific monitoring platforms.
  • Analyze historical freeze-up and breakup trends on Indian Creek and Tyonek lakes over past decades.
Interactive Experiment

Virtual Laboratory Simulator

🔬 Hands-on Virtual STEM Lab Community Climate Scientist

Phenology & Stream Temperature Data Logger

Log ice breakup dates, first bird calls, and summer stream temperatures. Compare your student dataset against 20-year Cook Inlet baseline records.

Field Inquiry Parameters:

Explore step-by-step variables, observation metadata, and field testing protocols directly from the official TTCD curriculum guide.

Active Protocol: Phenology & Stream Temperature Data Logger
Status: Standards Verified ✓
📋 Protocol Checklist
  • Follow teacher safety guidance and ethical collection standards.
  • Record 3 independent trials for data repeatability.
  • Compare local Tyonek observations with published Alaska State Standards.
Self-Grading Assessment

Comprehension Mastery Quiz

Test student understanding of scientific principles, local Alaska ecology, and problem-solving scenarios from the lesson guide. Earn the Community Climate Scientist credential!

📝 Comprehension Mastery Quiz Question 1 of 1

Why must scientific data loggers follow strict Quality Assurance / Quality Control (QA/QC) protocols?

Terminology & Dena’ina Context

Specialized Vocabulary Flashcards

🗂️ Interactive Vocabulary Deck Card 1 of 3

Click the card or press Space to flip. Use arrow keys to navigate.

Term Click to flip ↷

Phenology

Definition & Context Click to flip ↶

The study of cyclic and seasonal natural phenomena in plants and animals, especially in relation to climate and weather variations.

Alaska Context:

Examples include dates of first spring robin song, lake ice breakup, and fall highbush cranberry ripening.

Educator Guide

Curriculum Standards & Activity Protocol

📚 Standards Alignment (NGSS & Alaska Cultural Standards)

MS-ESS3-5

Ask questions to clarify evidence of the factors that have caused the rise in global temperatures over the past century.

NGSS
HS-ESS3-4

Evaluate or refine a technological solution that reduces impacts of human activities on natural systems.

NGSS
Cultural Standard E.2

Culturally-knowledgeable students understand the ecology and geography of the bioregion they inhabit.

Cultural

🏔️ Local Alaskan & Tebughna Context

  • TTCD operates continuous stream temperature data loggers across the district to track thermal stress on rearing coho salmon.
  • Tebughna hunters and youth observe when Cook Inlet sea ice forms and when ice breaks up on Tyonek lakes each spring.
  • Community science bridges remote village observations directly into statewide and global climate science models.

📦 Required Materials & Classroom Setup

✓ Calibrated digital stem thermometer✓ Handheld GPS unit or smartphone mapping application✓ Water turbidity transparency tube✓ Standardized waterproof field datasheets and clipboard

🔬 Step-by-Step Hands-on Activity Guide

  1. Step 1: Calibrate Sensors

    Submerge the thermometer probe in a 50/50 crushed ice and water slush. Ensure reading settles at 0.0°C +/- 0.5°C.

    💡 Instructor Tip: Never deploy an uncalibrated instrument in the field.

  2. Step 2: Take Replicate Field Measurements

    At the stream monitoring site, take three readings in mid-channel current at 60% water depth. Average the three numbers.

    💡 Instructor Tip: Measure in moving water, not stagnant backwater pools.

  3. Step 3: Log Geolocation & Upload Data

    Record latitude/longitude to 5 decimal places, photo of monitoring point, date, and cloud cover. Upload to community database.

    💡 Instructor Tip: Consistent monitoring sites enable decadal trend detection.

💬 Wrap-Up Discussion & Evidence of Learning

Discussion Questions:

  • How does warming stream water impact juvenile salmon survival and dissolved oxygen levels?
  • Why are tribal community members the most effective long-term environmental monitors?

Evidence of Learning Rubric:

  • Student can calibrate a digital sensor and log latitude/longitude metadata.
  • Student can graph water temperature vs time and interpret salmon thermal limits.
← All Youth Lessons & Resources